Using machine learning to help unravel plasticity in metals

The microstructure of many materials is essentially disordered, meaning that there are a large number of small-scale structural elements which can be arranged in many possible ways.  For instance, common metals, such as aluminum and nickel, are composed of a jumble of crystalline grains.  Atoms within the crystalline grain are themselves ordered, but atoms at a grain boundary, where most deformation originates, occupy seemingly random positions.  The mechanics of these disordered materials is one of the most famous open problems in materials physics.

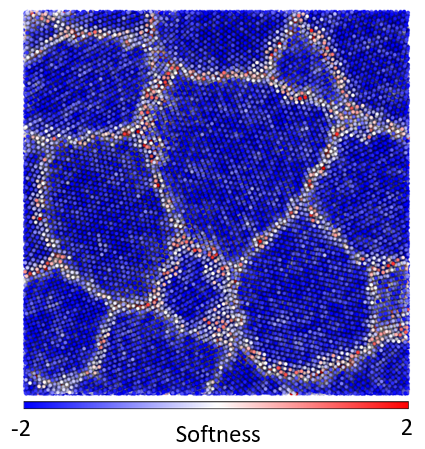
Machine learning algorithms can help cut through the structural complexity [1,2,3].  The local structure can be projected down from the high-dimensional configuration space to a subspace of a single dimension which is highly-correlated with the susceptibility of the local region to deform.  Then regions of weak structures can be readily identified so that the spatial distribution of weak spots can be connected to the origins of the material mechanical properties.  The machine learning method can also be reverse engineered to expose the attributes that contribute to the weakness of a region.  Furthermore, by looking for an Arrhenius relationship between temperature likelihood to deform, it is sometimes possible to identify the energy barrier associated with each small-scale deformation.

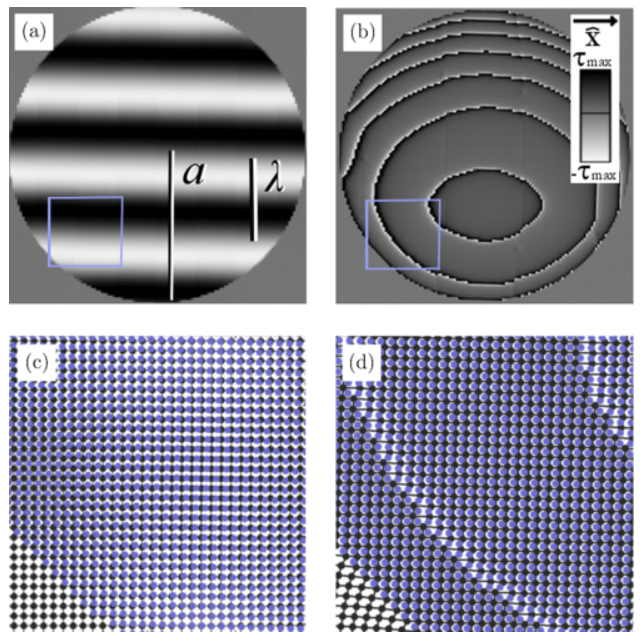
In previous work, I adapted and applied the above method, using a support vector machine, to study poly-crystalline materials.  Typically, defects (dislocations, vacancies, grain boundaries…) are said to control the mechanics of these materials, but the disordered regions within the core of the defects affects the mechanics of the defects themselves.  Our work demonstrated the dominant role of local structure in determining the weak spots within defects, even with realistic (delocalized) metallic bonding.  In this material, a lack of symmetry of the atomic environment was responsible for weakening an area of the material.  Contrary to expectations, though consistent with experimental measurements, the weak regions all had essentially the same energy barrier height preventing deformation.  The work helped illuminate the connection between disordered regions within poly-crystals and bulk glasses.


Softness is large at grain boundaries and small in the bulk of the grain. Softness is related to how shallow the energy barrier is that prevents atomic rearrangements. (Paper submitted.)

[1] Cubuk, Ekin Dogus, Samuel Stern Schoenholz, Jennifer M. Rieser, Brad Dean Malone, Joerg Rottler, Douglas J. Durian, Efthimios Kaxiras, and Andrea J. Liu. “Identifying structural flow defects in disordered solids using machine-learning methods.” Physical review letters 114, no. 10 (2015): 108001.

[2] Schoenholz, Samuel S., Ekin D. Cubuk, Daniel M. Sussman, Efthimios Kaxiras, and Andrea J. Liu. “A structural approach to relaxation in glassy liquids.” Nature Physics 12, no. 5 (2016): 469-471.

[3]  Sharp, Tristan A., Spencer Thomas, Ekin Dogus Cubuk, Samuel S. Schoenholz, David Srolovitz, Andrea J. Liu. “Using machine learning to extract atomic energy barriers in poly-crystalline materials.” Submitted 2017.  Accepted PNAS 2018.

Superlubricity: Sliding with very low stress

Although introductory physics classes often imagine frictionless surfaces, in reality, surfaces that slide past one another almost always radiate or dissipate some of their energy away into sound or heat.   For many materials, the friction force, Ff, increases linearly with the amount of microscopic area that is actually in contact.  (If the microscopic contact area increases linearly with the applied normal load, FN, then the system obeys Amontons’ famous law, Ff = μ FN where μ is the constant friction coefficient.)  However, theoretical work [1] predicts that the friction force between incommensurate lattices grows as a fractional power of area, such that the friction force per area tends to zero.  This suggests that contacting solids could be protected from significant shear stresses by specially-designed coatings.

However, the theoretical predictions of zero friction stress relied on several simplifying assumptions.  These include neglecting the presence of free boundaries, contact shape, and the 3D elasticity of the solids.  We developed fast elastic computational methods that seamlessly interface with molecular dynamics simulations to explore this phenomenon [2]. This allowed us to find the breakdown of the effect in realistic geometry at the atomic scale [3].  The breakdown occurs when the incommensurate surfaces are able to elastically deform to approximate similar commensurate surfaces.  This happens essentially via the mechanism of introducing lattice dislocations from the boundaries.  We describe how the breakdown depends on the contact area, the atomic interactions between the solids, and the similarity of the incommensurate configuration to a lower-energy commensurate configuration.

(a) The stress, τ, oscillates within a circular region of contact (of radius a) between two incommensurate materials of high stiffness. (b) Materials of low stiffness support lattice dislocations.  Atomic-scale resolution of the incommensurate lattices illustrate the origins of the stress.


[1] Hirano, Motohisa and Kazumasa Shinjo “Dynamics of friction: superlubric state.” Surface Science 283.1 (1993)
http://www.sciencedirect.com/science/article/pii/003960289391022H

[2] Pastewka, Lars, Tristan A. Sharp, and Mark O. Robbins. “Seamless elastic boundaries for atomistic calculations.” Physical Review B 86.7 (2012): 075459.
https://journals.aps.org/prb/abstract/10.1103/PhysRevB.86.075459

[3] Sharp, Tristan A., Lars Pastewka, and Mark O. Robbins. “Elasticity limits structural superlubricity in large contacts.” Physical Review B Rapid Communication 93 (2016): 121402(R)
https://journals.aps.org/prb/abstract/10.1103/PhysRevB.93.121402

Fast assessments of 3D shapes within cell populations

Within biological tissues, cell shape may be indicative of the chemical and mechanical micro-environment.  Experiments on isotropic and homogeneous packings of cells, as shown below, connect the 3D shapes with tissue properties.  Unfortunately, quantitatively measuring 3D shapes of cells is burdensome, requiring high-quality confocal microscopy and image post-processing.  Another approach to quantifying 3D cell shapes uses 2D imagery without ever reconstructing 3D shapes.  Instead, cell-vertex models with quasi realistic geometry can be used to  generate mappings between 3D shapes of cells and the ensemble of 2D shapes seen in a single image.   Researchers may now trace cells in simple 2D imagery to determine the distribution of shapes, and compare them to the model to determine the ensemble of 3D cell shapes.

We are working to release a software package to provide these 3D shape estimates from traces of 2D cells.  This method has allowed us to compare predictions from the 3D cell vertex model with experimental measurements.